|11 min read|Verena Merklinghaus
Google Shopping Price Comparison: How to Use It for Your Pricing Strategy
Google Shopping price comparisonprice comparison online storeGoogle Shopping pricesprice positioningecommerce price comparisonprice monitoring Google

Source: Unsplash
How Google Shopping Works as a Price Comparison Tool
Google Shopping aggregates product data from the Merchant Center of thousands of retailers. When a user searches for a product, Google displays a series of listings with images, prices, store names, and shipping costs. It's essentially a publicly accessible price comparison — free and in real time. Three aspects are particularly valuable for your pricing strategy:Step by Step: Using Google Shopping for Market Analysis
Step 1: Identify Your Core Products
Don't start with your entire catalog. Select the 10 to 20 products that account for the largest share of your revenue. These are the products where incorrect price positioning costs you the most money.Step 2: Search Systematically for Each Product
Open Google Shopping (shopping.google.com) and search for the exact product name — ideally with the UPC or manufacturer part number. This way you find exact matches instead of similar products. Record for each result:- Store name
- Product price
- Shipping cost
- Total price (product + shipping)
- Special features (e.g., "In stock," coupon notices)
Step 3: Structure Your Price Data
Enter the data into a spreadsheet and calculate the average, median, minimum, and maximum. The median is often more meaningful than the average because it's less distorted by individual outliers.Step 4: Determine Your Position
Compare your current price with the market. Where do you stand? Are you in the lower third, the middle, or the upper segment? This position should align with your brand strategy.
Source: Unsplash
Step 5: Derive Your Pricing Strategy
Based on the data, you make informed decisions: hold the price, lower it, raise it, or differentiate with added value (free shipping, bundles).
Source: Unsplash
Google Shopping vs. Dedicated Tools: What Does Each Deliver?
Not everything you need for a solid pricing strategy can be found on Google Shopping. Here's an honest comparison:| Criterion | Google Shopping | Dedicated Price Tools |
|---|---|---|
| Cost | Free | Free to paid |
| Coverage | Only retailers in Merchant Center | Any online store with public prices |
| Updates | Real-time (on search) | Depending on tool: hourly to daily |
| Historical data | None — snapshot only | Price trends over weeks/months |
| Automation | None — manual search | Automatic alerts on changes |
| Shipping costs | Often visible | Depends on tool |
| Catalog breadth | Tedious with many products | Scalable to hundreds of products |
| Alerting | Not available | Push/email on price changes |
Calculating Your Google Shopping CPC and ROAS
Before adjusting prices based on Google Shopping data, understand the advertising economics. Here is how to calculate your Cost Per Click (CPC) efficiency and Return on Ad Spend (ROAS) for different price points:Google Shopping CPC & ROAS Calculator
======================================
Product: Bluetooth Headset
Current CPC: $0.45
Daily Budget: $30.00
Daily Clicks: $30.00 / $0.45 = 67 clicks
At price point $79.99 (above market):
Conversion rate: 1.2%
Daily sales: 67 x 0.012 = 0.8
Daily revenue: 0.8 x $79.99 = $63.99
ROAS: $63.99 / $30.00 = 2.13x
Cost per acquisition (CPA): $0.45 / 0.012 = $37.50
At price point $69.99 (at market):
Conversion rate: 2.1%
Daily sales: 67 x 0.021 = 1.4
Daily revenue: 1.4 x $69.99 = $97.99
ROAS: $97.99 / $30.00 = 3.27x
Cost per acquisition (CPA): $0.45 / 0.021 = $21.43
Improvement: +53% ROAS by aligning with market pricePrice Competitiveness Scoring
Use this formula to quantify how competitive your pricing is across your catalog. A score of 100 means you match the market median exactly:Price Competitiveness Score (PCS)
=================================
Formula: PCS = (Market Median / Your Price) x 100
Example calculations:
Product A: Median $67.50, Your price $79.99
PCS = (67.50 / 79.99) x 100 = 84.4 → Overpriced
Product B: Median $32.00, Your price $24.99
PCS = (32.00 / 24.99) x 100 = 128.1 → Underpriced
Product C: Median $45.00, Your price $44.50
PCS = (45.00 / 44.50) x 100 = 101.1 → Competitive
Scoring ranges:
Below 90: Significantly overpriced — risk of lost sales
90 - 97: Slightly above market — justify with value
97 - 103: Competitive sweet spot
103 - 110: Slightly underpriced — potential margin gain
Above 110: Significantly underpriced — leaving money on table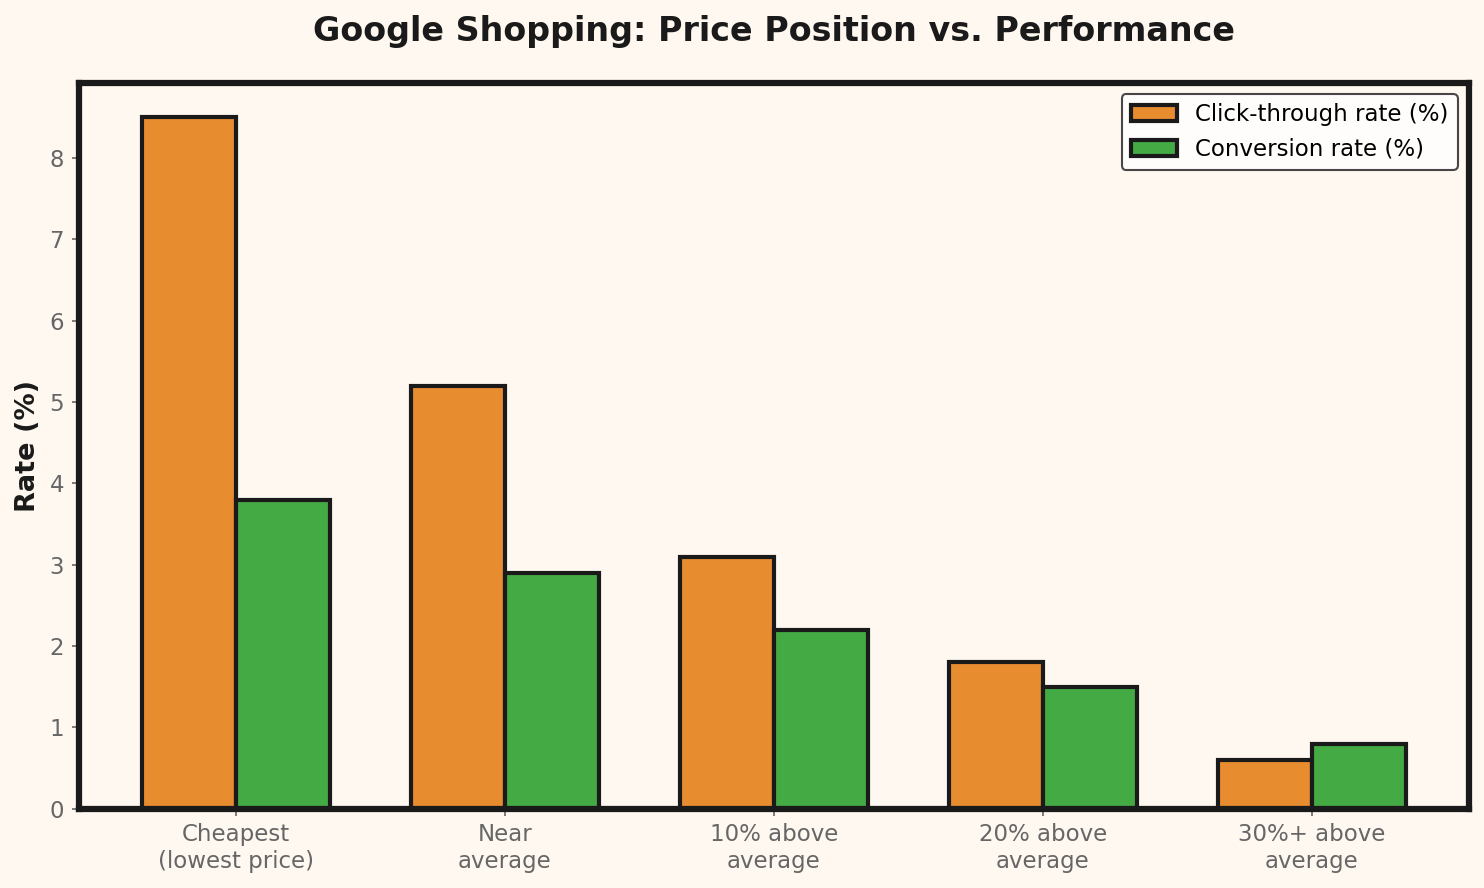
Google Shopping Bid Strategy Comparison
| Strategy | Best For | Avg. CPC | Control Level | ROAS Potential |
|---|---|---|---|---|
| Manual CPC | Small catalogs (<50 products) | $0.30-$0.80 | High | Medium |
| Enhanced CPC | Learning phase, new campaigns | $0.35-$0.90 | Medium | Medium-High |
| Target ROAS | Established products with data | $0.25-$1.20 | Low | High |
| Maximize Clicks | Market research, traffic focus | $0.20-$0.60 | Low | Low |
| Maximize Conversions | Proven products, scaling | $0.40-$1.50 | Low | High |
Price Adjustments Based on Google Shopping Data
Once you have the market data, things get concrete. Here are two typical scenarios with worked examples:Scenario 1: You're Significantly Above the Market Average
You sell a Bluetooth headset for $79.99. Google Shopping shows you that most competitors are priced between $59 and $69. Your price is 18% above the median.Current situation:
Your price: $79.99
Market median: $67.50
Your purchase price: $38.00
Your current margin: $79.99 - $38.00 = $41.99 (52.5%)
Conversion rate at $79.99: 1.2%
Monthly visitors: 3,000
Monthly sales: 36
Option A — Lower price to market level ($69.99):
New margin per unit: $69.99 - $38.00 = $31.99 (45.7%)
Expected conversion rate: 2.1% (typically +70-80% at competitive price)
Expected sales: 3,000 x 0.021 = 63
Profit before: 36 x $41.99 = $1,511.64
Profit after: 63 x $31.99 = $2,015.37
Additional monthly profit: +$503.73 (+33%)Scenario 2: You're Giving Away Margin by Pricing Too Low
You sell a yoga mat for $24.99. On Google Shopping, the market average is $32. You're 22% below the median — and there's no strategic reason for it.Current situation:
Your price: $24.99
Market median: $32.00
Your purchase price: $11.50
Shipping cost (you absorb): $4.90
Your total cost per unit: $11.50 + $4.90 = $16.40
Your profit per unit: $24.99 - $16.40 = $8.59
Monthly sales: 210
Option B — Raise price to $29.99 (still below median):
New profit per unit: $29.99 - $16.40 = $13.59
Expected sales decline: -8% (price remains below market)
Expected sales: 210 x 0.92 = 193
Profit before: 210 x $8.59 = $1,803.90
Profit after: 193 x $13.59 = $2,622.87
Additional monthly profit: +$818.97 (+45%)
Calculate the actual margin after sales tax:
Net amount at $29.99 (e.g. 8% tax): $29.99 / 1.08 = $27.77
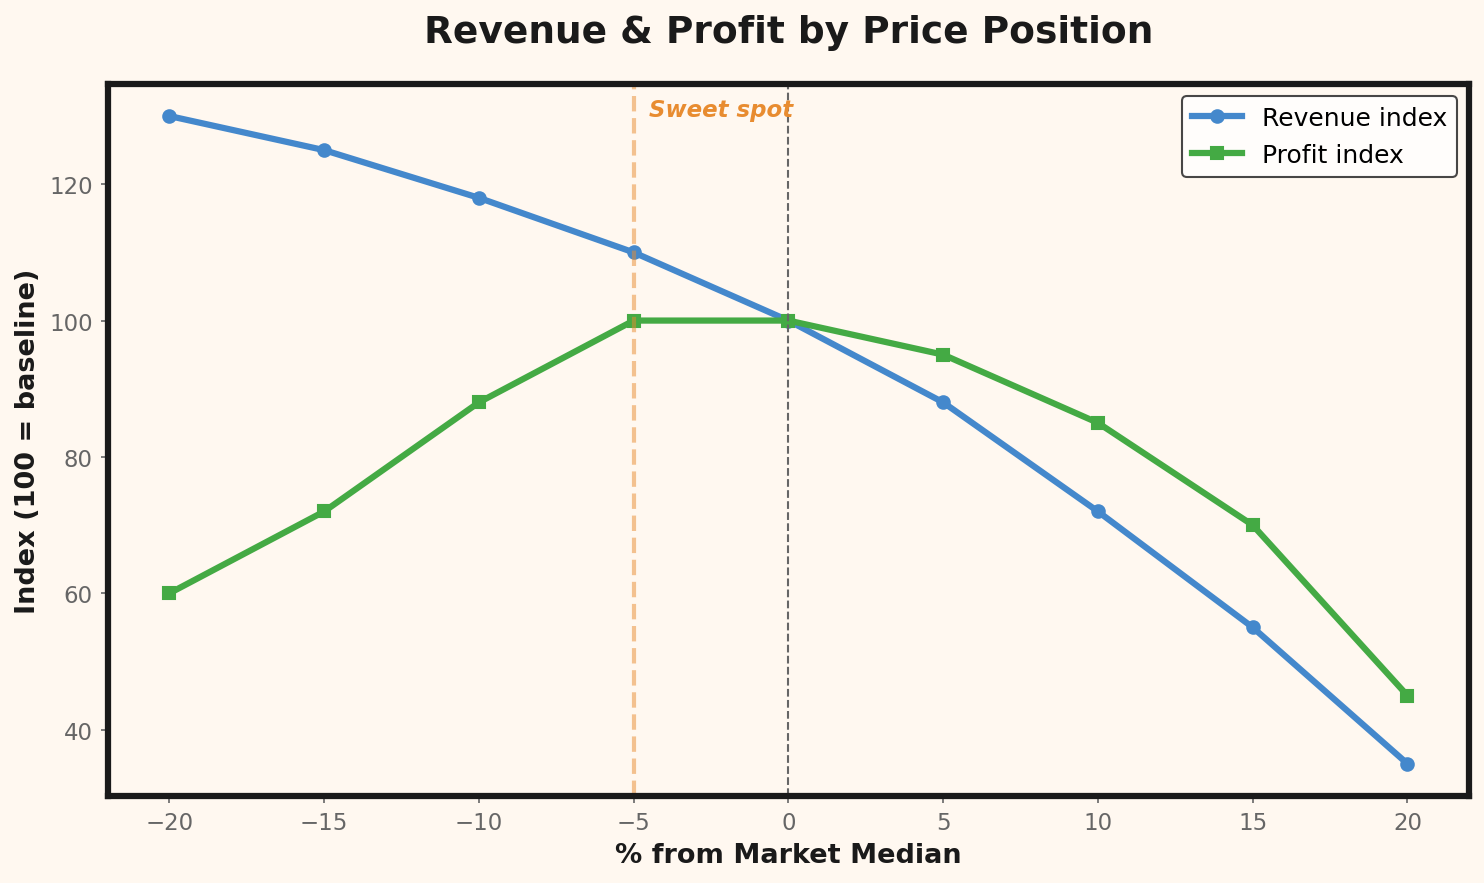
Net margin: $27.77 - $16.40 = $11.37 (41.0%)Price Positioning: The Lowest Price Isn't Always the Best
A common mistake: store owners see a competitor on Google Shopping pricing lower, and reflexively drop their price. This leads to a price war that nobody wins. Instead, choose your price positioning deliberately:- Price leader (bottom third): Only works with low operating costs and high volume. Rarely sustainable for small shops.
- Mid-range (within 5% of the median): Signals competitiveness without entering a price war. The safest position for most online stores.
- Premium (top third): Requires clear differentiation — better service, exclusive products, strong brand. If you can deliver that, this is the most profitable position.
Five Common Mistakes in Google Shopping Price Comparison
1. Comparing Apples to Oranges
Not every result on Google Shopping is truly comparable. Watch for: same product variant (color, size), same condition (new vs. refurbished), same scope of delivery. A seemingly cheaper price might turn out to be an offer without accessories.2. Ignoring Shipping Costs
A competitor shows $49.99 for a product you offer at $54.99 with free shipping. But they charge $6.90 for shipping — their total price is $56.89. You're cheaper, not them. Always compare total prices.3. Looking Once and Forgetting
Google Shopping shows you a snapshot in time. Prices change — sometimes daily. A one-time analysis isn't enough. Schedule regular checks, at least every two weeks for your core products.4. Treating All Competitors Equally
Not every seller on Google Shopping is a relevant competitor. Wholesalers with dumping prices, marketplace sellers with questionable quality, or shops from other countries with different cost structures distort the picture. Filter deliberately.5. Seeing Only the Price, Not the Strategy Behind It
When a competitor suddenly drops 30% below market price, it could mean: clearance sale, warehouse liquidation, miscalculation, or a loss leader. Don't immediately respond with a price cut. First observe whether the price is permanent.Product Category Performance Benchmarks
| Category | Avg. CPC | Avg. Conversion Rate | Avg. ROAS | Price Sensitivity |
|---|---|---|---|---|
| Electronics | $0.55 | 1.8% | 4.2x | High |
| Clothing & Apparel | $0.38 | 2.3% | 3.8x | Medium |
| Home & Garden | $0.42 | 2.1% | 4.5x | Medium |
| Health & Beauty | $0.35 | 3.1% | 5.1x | Low |
| Sports & Outdoors | $0.48 | 1.9% | 3.6x | Medium-High |
| Toys & Games | $0.32 | 2.7% | 4.8x | Seasonal |
| Pet Supplies | $0.29 | 3.4% | 5.5x | Low |
| Office Supplies | $0.25 | 2.8% | 4.1x | High |

